Wednesday, March 25, 2015

Lab#4 Modeling the fall of an object falling with air resistance

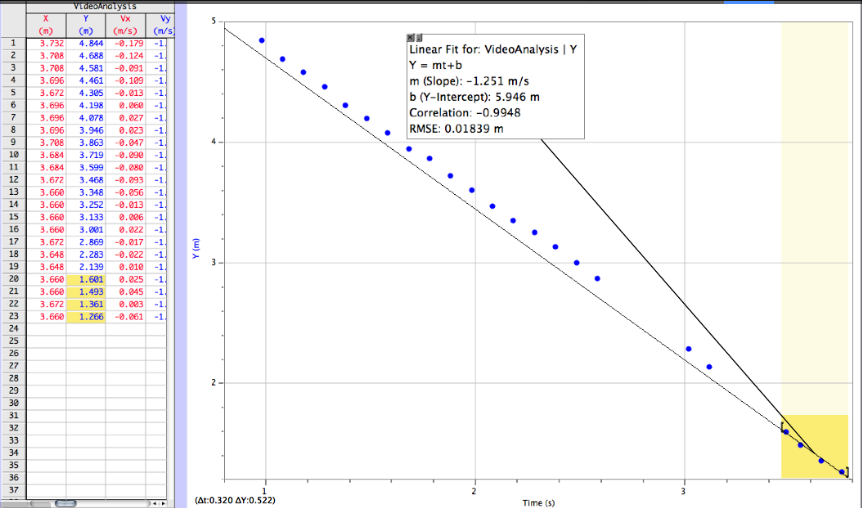
Part 1: Determining the relationship between air resistance force and speed

Purpose: 
    To observe the effect of air resistance on falling coffee filters and in determining how the terminal velocity of a falling object is affected by air resistance and mass, choose which of the two force models best represents the air resistance effect on the falling coffee filters.

Materials
 Computer 
Vernier Motion Detector 
Vernier computer interface 
5 basket-style coffee filters


k=A=0.01201+/-0.001220
n=B=1.738+/-0.1562
Fresistance=kv^n


Part 2: Modeling the fall of an object including air resistance


    When falling, there are two forces acting on an object: the weight, mg, and air resistance. In the real world, because of air resistance, objects do not fall indefinitely with constant acceleration. At terminal velocity, the downward force is equal to the upward force, so depending on whether the drag force follows the first or second relationship.


Lab#7 Modeling Friction Forces

Part 1: Static Friction:
    Static friction describes the friction force acting between two bodies when they are not moving relative to one another.

Purpose:
    determine the coefficient of static friction


materials:
Set up:
Procedure:


    Scales
    Wooden blocks
    A cup
    Water
    Pulley
    String

    Place the felt-side of the block o the lab table. Tie a string to the blockand over a pulley at end of the lab table.
    

   1.  Weigh a wooden block and record it;
   2. Add water to the cup shown a little bit of a time until the block just starts to slip, record the mass of the cup with water.
   3.  Weigh three different wooden blocks and record each value, add a wooden block a time, then repeat step 2.
   3. Determine the coefficient of static friction.


Part 3: Static Friction From A Sloped Surface
     Place a block on a horizontal surface. Slowly raise one end of the surface, tilting it until the block starts to slip. Use the angle at which slipping just begins to determine the coefficient of static friction between the block and the surface.

Part 4: Kinetic Friction From Sliding a Block Down And Incline
    With a motion detector at the top of an incline steep enough that a block will accelerate down the incline, measure the angle of the incline and the acceleration of the block and determine the coefficient of kinetic friction between the block and the surface from your measurements.


Part 5: Predicting The Acceleration of a Two-mass System
    Using the coefficient of kinetic friction results from experiment (4) above, derive and expression for what the acceleration of the block would be if using a hanging mass sufficiently heavy to accelerate the system.




Lab#6 Propagated uncertainty in measurements

1. Measuring the Density of Metal Cylinders


Purpose:
Materials:
Procedure:
  2. Measure the mass of three different metal cylinders and record the values.
  3. Use the measured values to determine the mass of them.
Materials:
Procedure:
  3. Use the measured values to determine the mass of the unknown mass.

  Calculate the density of some metal cylinders by measuring their height and diameter.

  Calipers
  scales
  metal cylinders

  1. Measure the height and the diameter of three different metal cylinders, then record the values.


  4. Use the known uncertainties to determine the propagated uncertainty in the calculated value of the density.


2. Determination of an unknown mass

Purpose:
  Find unknown mass and propagated uncertainty by measuring two forces and the angles between the force and horizontal.

  two clamps
  two spring scales
  elevation degrees
  objects with unknown mass

  1. Set up two clamps onto the edge of a lab table, with a long rob in each. suspend the two spring scales at asymmetric angles and hang the unknown mass on them.
  2. Measure the angles and record the scale readings.

  4. Use the known uncertainties to determine the propagated uncertainty in the calculated value of the mass.


Therefore,

Tuesday, March 24, 2015

Lab#3 Non-constant acceleration problem/Activity solution

Numerical integration:

 1. Open up a new Excel spreadsheet and enter the following:
     A1: △t=
     B1: 0.2
     A2: t
     B2: a
     C2: a_avg
     D2: △v
     E2: v
     F2: V_avg
     G2: △x
     H2: x
 2. Fill down to cell A3
 3. Input a=2t^2 into cell B3 that will let you calculate the acceleration at any time.
 4.Fill that formula down to cell B4.
 5. in cell C4 calculate the average acceleration for that first 2.0 s interval.a_avg=(a0+a1)/2
 6. in cell D4 calculate the change in velocity for that first time interval. △v=a_avg*△t
 7. in cell E4 calculate the speed at the end of  that time interval. v=v0+△v
 8. in cell F4 calculate the average speed of the elephant. △v=(v0+v1)/2
 9. in cell G4 calculate the change in position. △x=v_avg*△t
 10. in cell H4 calculate the position of the elephant. x=x0+△x
 11. "Fill Down" the contents of Row 4 to the rest of the spreadsheet.


Activity solution:

    A 5000-kg elephant on frictionless roller skates is going 25 m/s when it gets to the bottom of a hill and arrives on level ground. At that point a rocket mounted on the elephant's back generates a constant 8000 N thrust opposite the elephant's direction of motion. The mass of the rocket changes with time (due to burning the fuel at a rate of 20 kg/s) so that the m(t)=1500 kg -a0 kg/s*t.
  Find how far the elephant goes before coming to rest.


Monday, March 23, 2015

Lab#1 Finding a relationship between mass and period for an inertial balance


Purpose 
  The purpose of this lab is to come up with an equation to describe the period of an inertial balance when different masses are set on it.


MaterialsC-ClampInertial BalanceMasking Tape USB cable, photogateComputer Multiple Different Masses

Set up    1. use a C-clamp to secure the inertial balance to the tabletop, Pur a thein piede of jmasking taoe one the end the inertial balance;    2. Set up a photogate so the when the balance is oscillating the tape completely passes through the beam of the photogate.
Procedure    With no extra mass on the tray, pull back the inertial balance. Take notice of how much force you are using to pull back the balance, for you must use the same force for each trial in order to obtain accurate results. Record the period of the balance.For each additional trial, add an extra 100 grams to the balance and record the period. In this experiment we repeated the trail until 800 grams. Multiple trials will allow us to create a more accurate curve. Always use the same amount of force when pulling back the inertial balance.               
    3. we were given the initial equation:T=A(m+Mtray)^n. With this equation, we had three unknowns: AMtray, and n. To make a more reasonable looking equation, we took the natural logarithm of each side, which gave us: lnT=nln(m+Mtray)+lnA. This equation mimicked that of y=mx+b, in that lnis yn is m, ln(m+Mtray) is x, and lnis b. To begin graphing our data, we first opened a blank LoggerPro document, which allowed us to plot data in an "x" and "y" table. In this table, we labeled the "x" column "Mass (kg)" and the "y" column "Period (sec)." We then created three new columns for (m+Mtray), lnT, and ln(m+Mtray) by first clicking the "Data" tab, and then "New Calculated Column"  Finally, we had to create a parameter Mtray, which would be our initial guess for the mass of the inertial balance by itself. To do this, we clicked the "Data" tab, and then "User Parameters." 
T=0.6489(m+0.369)^0.6489 


    When making the graph, we set the vertical axis as lnand the horizontal axis as ln(m+Mtray). This gave us a linear graph with a slope "m" (which is n) and a y-intercept "b" (which is lnA). We then had to adjust the parameter Mtray several times to get a correlation coefficient that was as close to 1 as possible. 


Deriving The Final Equation

    Once we had our originally unknown values for n, lnA, and Mtray, we were now able to complete our equation of T=A(m+Mtray)^n using algebra  When testing the equations, we found that we were roughly 0.005 seconds off from the actual period for most of the masses. When evaluating the mass of the tape dispenser , using Mtray equal to 0.369kg


Sunday, March 8, 2015

Lab#2 Determination of g and some statistics for analyzing data


Purpose
 To examine the validity of the statement: In the absence of all other external forces except gravity, a falling body will accelerate at 9.8 m/s^2.


 Set up


    1. Turn the dail hooked up to the electromagnet up a bit;
    2. Hang the wooden cylinder with the metal ring around it on the electromagnet;
    3. Turn on the power on the sparker thing;
    4. Hold down the spark button on the sparker box;
    5. Turn the electromagnet off so that the thing falls;
    6. turn off power to the sparker thing;
    7. Tear off the paper strip and set up the spark paper for the next person to get their data.
    There are a series of dots on the paper corresponding to the position of the falling mass every 1/60th of a second 


Open Microsoft Excel
  1. In cell A1 enter Time; in cell A2 enter 0; in cell A3 enter =A2+1/60  If you highlight ell A3 and several cells below that, the n choose the Edit/Fill/Down menu Excel auto matically fill the cells below with 2/60, 3/60, etc 2.choose a dot to be t=0s dot. Place the 0-cm mark of the 2-meter stick there.  In cell B1 enter Distance; in cell B2 enter 0; in cell B3 enter the positions of the 2th dot from spark tape. Enter the rest of the dot positions in cell B4,B5,etc. 3. In cell C1 enter △x; in cell C2 enter=(B3-B2), Fill down this to the cells below this one. 4. In cell D1 enter Mid-interval time; in cell D2 enter=A2+1/120, then Fill Down. 5. In cell E1 enter Mid-Interval speed; in cell E2 enter=C2(1/60); then Fill Down. 


    Graphing above data


Analyzing the class'data for g:
  Open up a mewfile in Microsoft Excel
In cell A1 enter Value of g; in cell Aw through A11, enter class' balues for g frome the spark tape free fall experiment; in cell A12 enter "=average(a2:a11)"; in cell B1 enter "dev from mean"; in cell B2 enter"=a2-$a$12". 
  Highlight the cell B2 through B11. enter the Edit menu select the option Fill Down
  Click on the ells B3 and B4 and see what formula is entered there.I got the form below.


     68% confident value of g is in this rang (916 cm/s^2 < g <968 cm/s^2) our experiment has no errors in its assumptions.
    Systematic error:stuff you can blame on a flaw in your assumptions.
    Random error: stuff we can't tie down blame for.